scRNA-seq reveals the diversity of the developing cardiac cell lineage and molecular building blocks of the primary pacemaker
We present a high-resolution single-cell atlas of the whole developing
heart in the zebrafish, a model organism increasingly used to study heart biology.
Our data consisted of over 50 000 cells representing the building blocks of the
zebrafish heart at 48 and 72 hpf, with two pseudoreplicates sequenced per time-point.
We distinguished 18 discrete cell populations comprising major cardiac cell lineages
and sublineages. Here, we provide our dataset as an accessible community resource
envisaged to pave the way for in-depth analysis of cell populations
with high specificity.
While we are in the process of publishing our work
should you choose to use our data in your publication, please cite the preprint.
Abu Nahia K, Sulej A, Migdal M, Ochocka N, Ho R, Kaminska B, Zagorski M, Winata C,. scRNA-seq reveals the diversity of the developing cardiac cell lineage and molecular building blocks of the primary pacemaker. BioaRxiv:2023.06.26.546508. Available from: https://www.biorxiv.org/content/10.1101/2023.06.26.546508v1
Methods
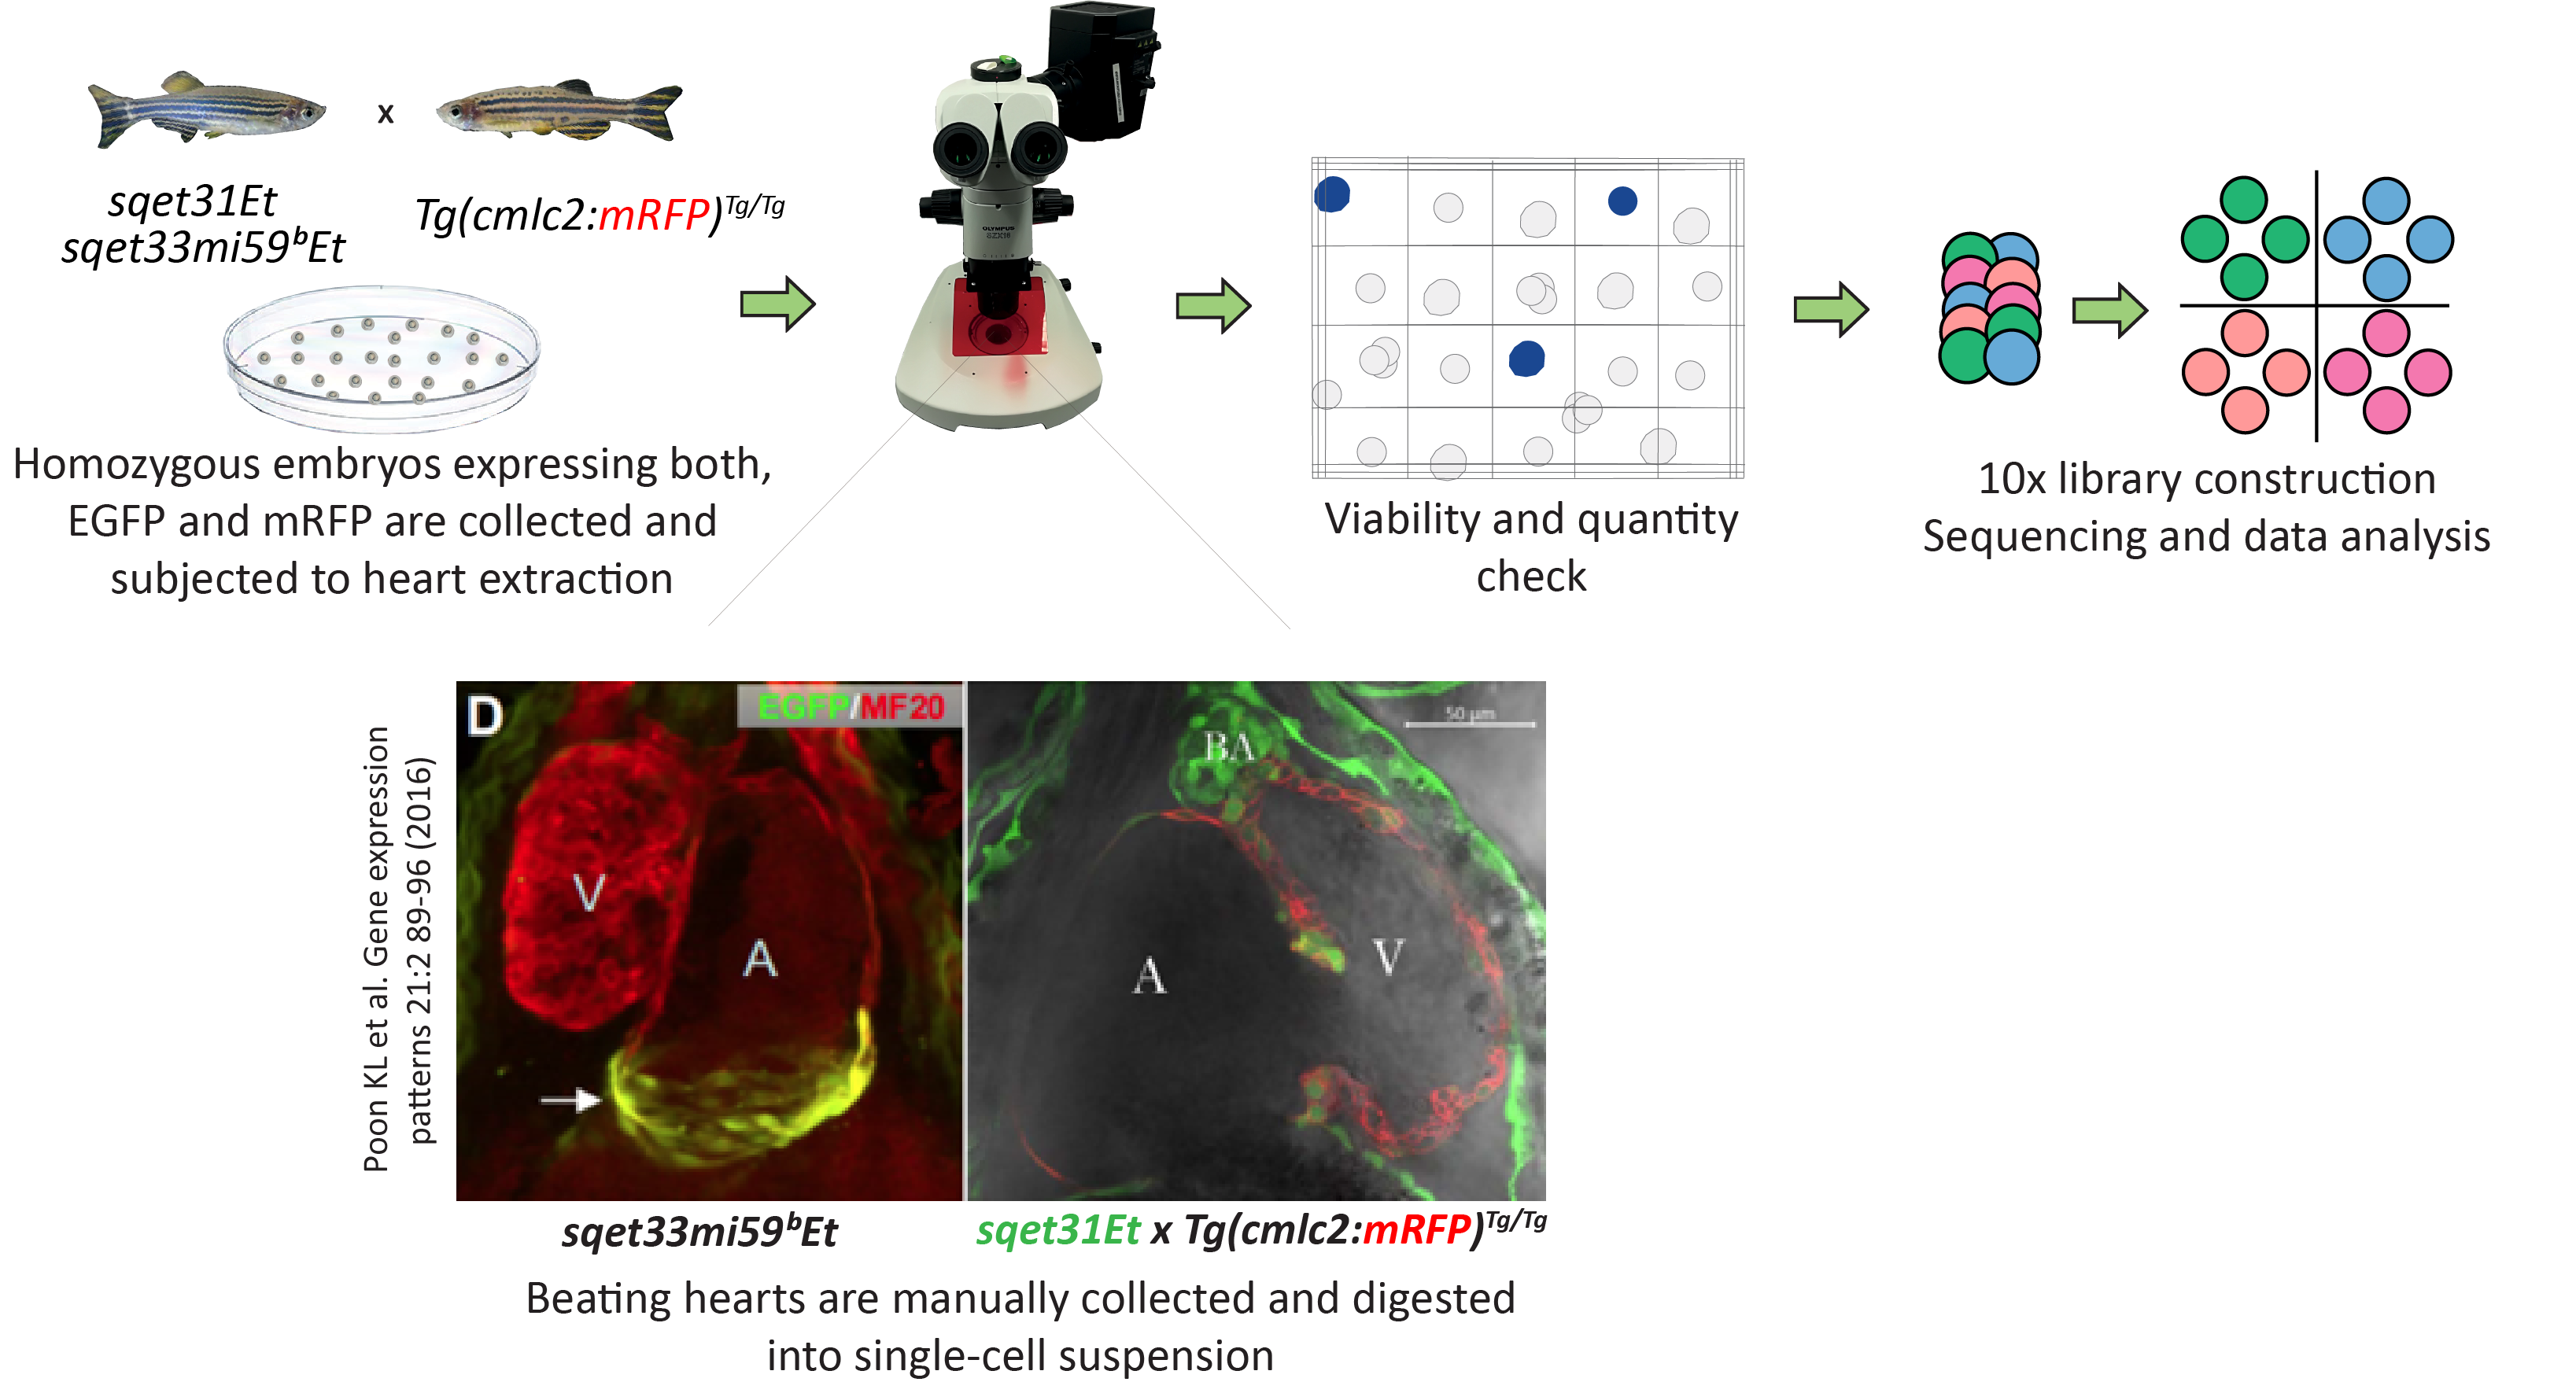
Whole hearts were extracted from double transgenic individuals
sqet31Et x Tg(myl7:mRFP)
and
sqet33mi59BEt x Tg(myl7:mRFP)
and dissociated
into single cells which were subsequently encapsulated according to the 10x
Genomics workflow (detailed methods available in our publication).
The transgenic lines
sqet33mi59B
and
sqet31Et
expressed EGFP in cells of the sinoatrial (SA) and atrioventricular (AV)
pacemaker regions, which provided an internal control for rare cardiac cell populations.
The transgenic line
Tg(myl7:mRFP)
was used to additionally
demarcate cardiomyocytes (CMs), which is the most technically challenging
cell type to isolate, and enhance cell clustering. Sequencing reads were
mapped to the zebrafish reference genome GRCz11 (Ensembl release 100)
extended with additional EGFP and mRFP sequences. Detailed parameters
for cell filtering and downstream data processing can be found in our preprint.
Feel free to contact us for further enquiries:
kanahia@iimcb.gov.pl, cwinata@iimcb.gov.pl
and visit our lab webpage
https://zdglab.iimcb.gov.pl/

Click the dot in the dot plot to display the gene expression matrix for the cell of interest
Marker genes
Marker genes between clusters were calculated according to Seurat FindMarkers function using default parameters.
Enrichment analysis
This tool utilizes a standard hypergeometric test (from ClusterProfiler package)
which enables the performance of gene enrichment analysis. The test is performed
on a gene list provided by the user which can be further annotated by single-cell
clusters representing embryonic zebrafish heart or ZFIN anatomical terms.
The gene enrichment analysis is visualized by dotplot as well as summary table reflecting
all the metrics, including enriched genes. At the moment, the
Ensembl Gene IDs
and
Gene names
are supported.
1. Paste your genes of interests (
one gene per line
).
2. Select annotation type.
3. Click the button.
Marker genes: Myocardium
Marker genes between clusters were calculated according to Seurat FindMarkers function using default parameters.
Differential expression between clusters
This panel allows for performing differential gene expression analysis between selected clusters. The results are visualized by a volcano plot and a summary table with respective metrics. Genes can be labeled based on the significance level or log2FoldChange. The slider can be used to specify the number of gene labels to show.
